Monday 2 November 2026
The tape said: SI closed above prior value and the letters read accepted above; a close below 49.1 USD undoes the acceptance.
Read
What changed
against the previous session13 levels moved · commentary
Levels that moved: initial balance high, initial balance low, invalidation, point of control, prior point of control, prior value area high, prior value area low, session close, session high, session low, session open, value area high, value area low.
The day type is now a normal day. The open type is now an open-drive up. The close type is now in the upper part of the range. The acceptance read is now accepted above. The value location is now above value. Value migration is now higher. The location band is now near its average. The rotation trend is now stable.
The auction
1 sessionThe session closed above prior value.
Against prior value the letters read accepted above (acceptance needs a close at least one tick beyond prior value).
Today's value area migrated higher against the prior session's.
Balance status: no active area.
This read is invalidated on a close below 49.1 USD (prior value area low).
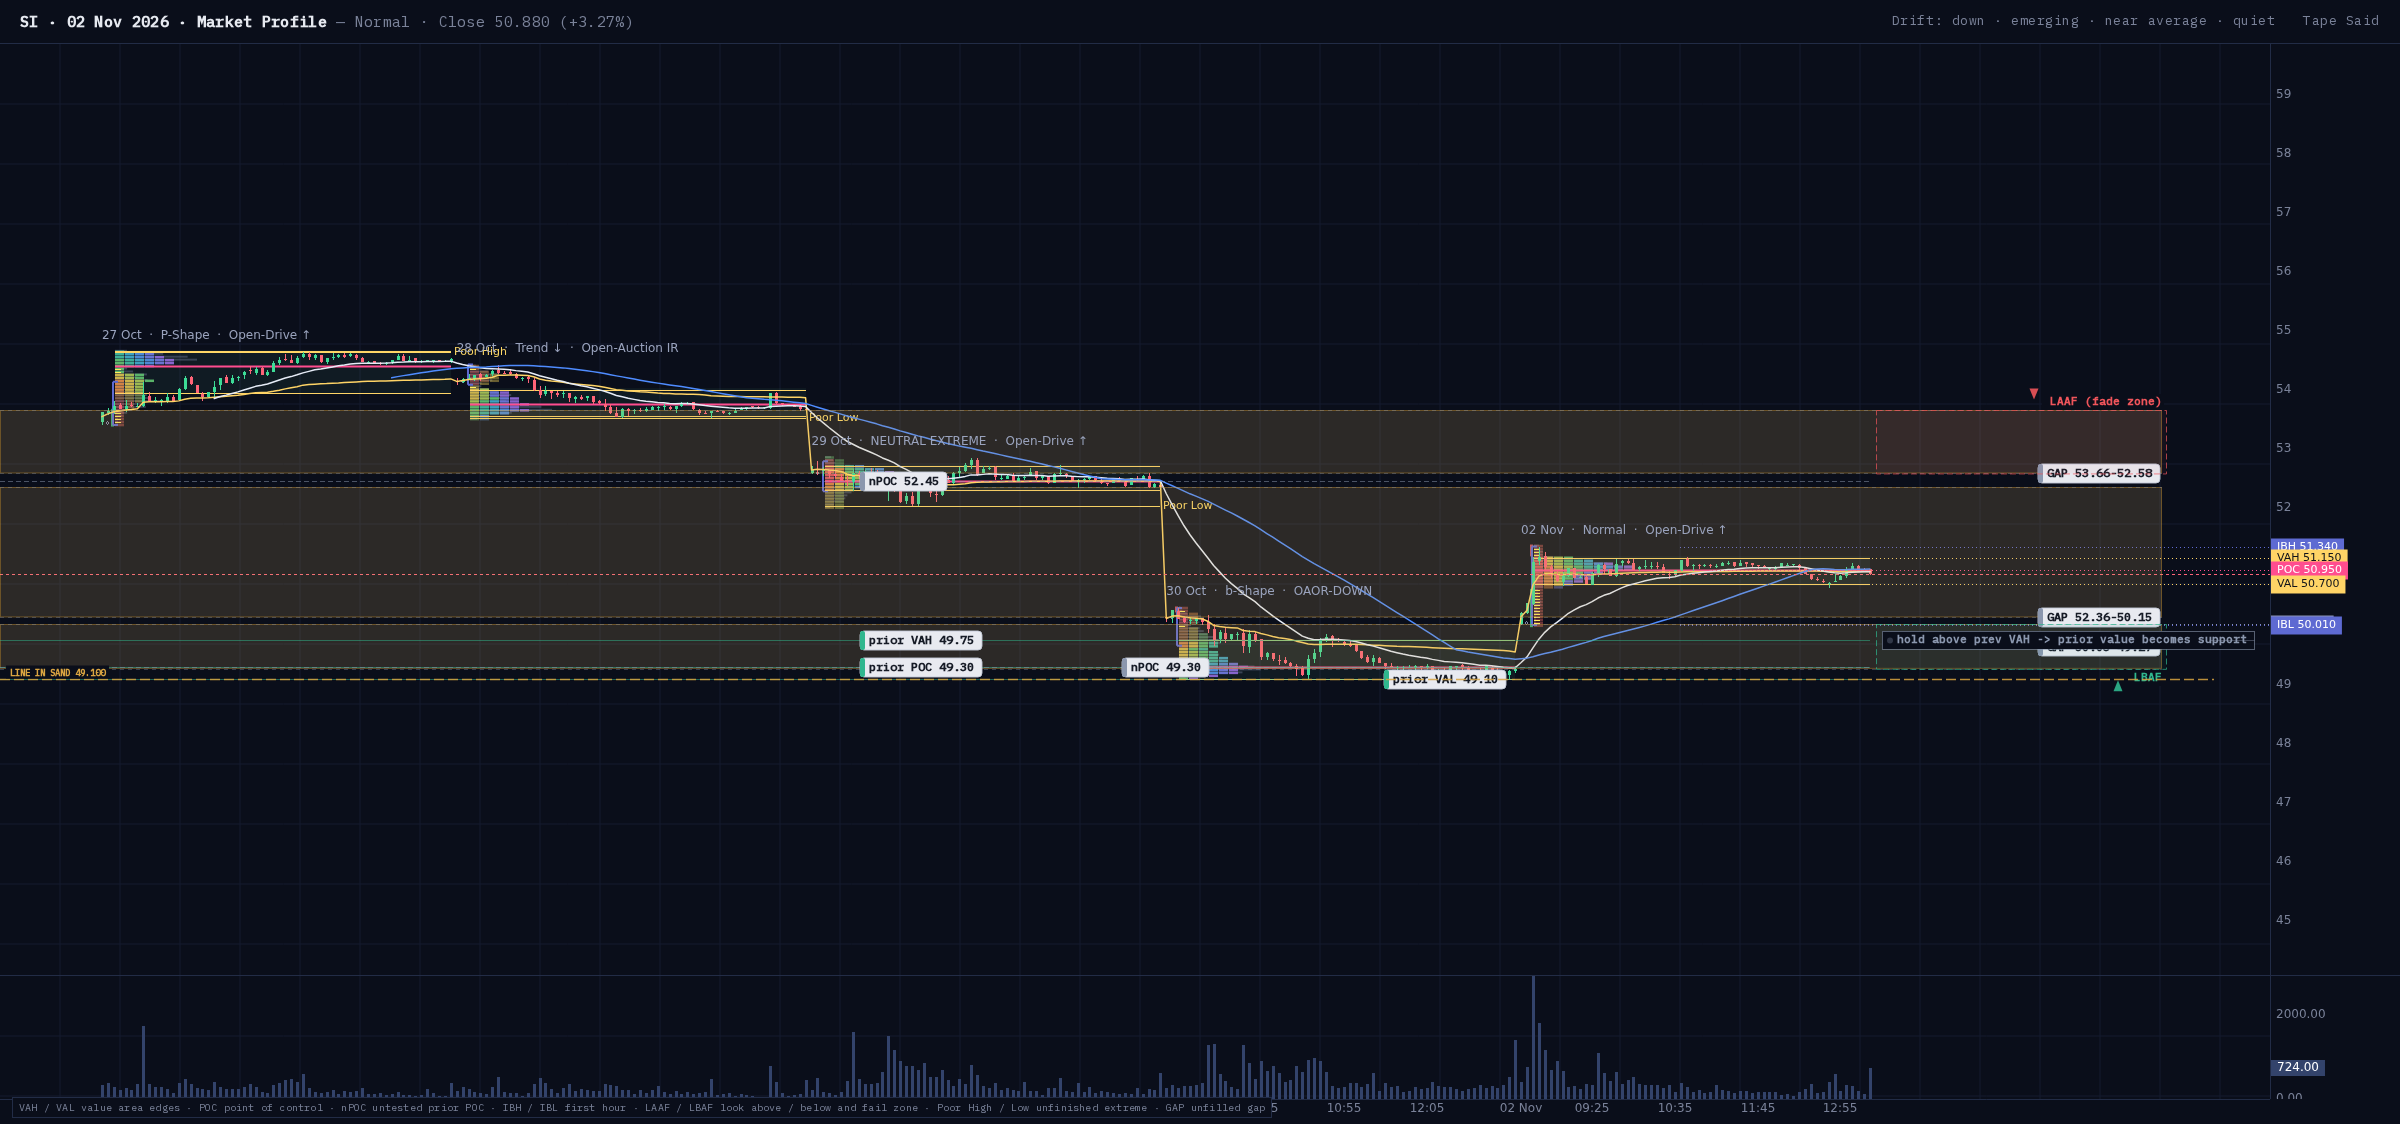
The open read as an open-drive up, and the letters read accepted above prior value. Value migrated higher, and the two value areas do not overlap. The range stayed inside the initial balance, and the close sat in the upper part of the range. The naked POC at 52.45 USD was not touched by the range.
Drift
20–60 sessionsOver the last 20-60 sessions the Drift read is down and the phase is emerging.
Price sits near its average, 0.05 ATR from its reference.
The efficiency ratio over that window is 0.44.
Daily ranges have been small against the longer history.
Over these weeks the direction is down, and price sits near its average.The latest close is 0.05 ATR away from its recent average. The auction read for the single session leans the other way; the two horizons point different ways and neither is wrong.
Volatility
The volatility proxy VXSLV sits in its normal band at 46.39 (between the bottom and top fifths of its own history). ATR(14) is 2.2 USD and the expected move for one session is 2.92% (ETF-option based; one-session heuristic from a 30-day option-implied level; not a forecast).
The two horizons. The two horizons disagree: the auction read (1 session) points above while the Drift read (20-60 sessions) points below. That is the horizons disagreeing, not a contradiction to resolve.
Levels
| Prior value area highUpper edge of the prior session's value area | 49.75USD |
|---|---|
| Prior value area lowLower edge of the prior session's value area | 49.1USD |
| Prior point of controlThe prior session's TPO point of control: the price row with the most TPO prints (time at price) | 49.3USD |
| Value area highUpper edge of today's value area | 51.15USD |
| Point of controlToday's TPO point of control: the price row with the most TPO prints (time at price) | 50.95USD |
| Value area lowLower edge of today's value area | 50.7USD |
| Session openWhere the session opened | 50.03USD |
|---|---|
| Session highThe session's highest price | 51.34USD |
| Session lowThe session's lowest price | 50.01USD |
| Session closeWhere the session closed | 50.88USD |
| Initial balance highTop of the first hour's range | 51.34USD |
| Initial balance lowBottom of the first hour's range | 50.01USD |
| InvalidationThe level that undoes today's read | 49.1USD |
|---|---|
| Nearest naked POC aboveAn untested prior TPO point of control above price: the price row with the most TPO prints (time at price) | 52.45USD |
| Nearest naked POC belowAn untested prior TPO point of control below price: the price row with the most TPO prints (time at price) | 49.3USD |
Unfilled gaps · 3
| Gap 1Upper / lower edge of an unfilled gap | 52.355 / 50.145 |
|---|---|
| Gap 2Upper / lower edge of an unfilled gap | 50.03 / 49.27 |
| Gap 3Upper / lower edge of an unfilled gap | 53.655 / 52.58 |
All prices in US dollars (USD) on SIZ2026. Meanings are the Meaning column of the post's level table.
Scenarios
Next session
1 scenarioHold above prev VAH → prior value becomes support
- Trigger
- close above 49.75 USD (prev VAH)
- Invalid before
- close below 49.75 USD (prev VAH)
- Invalid after
- close below 49.1 USD (prev VAL)
- Target
- none
- Horizon
- 1 session
- Expires
- 2026-11-03 18:25 UTC
If a five-minute close above 49.75 USD is made, prior value reads as support. A five-minute close below 49.75 USD before the trigger voids the setup, and a close below 49.1 USD after the trigger ends it.
Prices are frozen at issue and never re-resolve to a later session's level.
Opening playbook
against the 2026-10-30 value area- Open above49.75 USD (2026-10-30 value area high)Would extend today's acceptance above prior value; the line in the sand stays 49.1 USD.
- Open insidethe 2026-10-30 value area (49.1–49.75 USD)Would return the auction to the 2026-10-30 value area and challenge today's acceptance above it; watch for a hold or rejection of 49.75 USD.
- Open below49.1 USD (2026-10-30 value area low)Would put today's acceptance above prior value in doubt and move the auction through the 2026-10-30 value area; watch for a hold or rejection of 49.1 USD.
Previous scenarios
| Scenario | Issued | Trigger | Outcome | Move (ATR) |
|---|---|---|---|---|
| Hold below prev VAL → prior value becomes resistance | 2026-10-30 | triggered | horizon end | -0.3 |
"Triggered" records that the trigger condition was met. It is not a correct call and is never scored as one.
The trigger, a close below 52.3 USD, was met; the horizon ended with the move against the read larger than the move for it, finishing against it.
Chart
Data note
How this post was made
- Observation cutoff: 2026-11-02T18:25:00+00:00 for the session reads; the daily Drift and volatility reads run through the day close, 2026-11-02T22:00:00+00:00. Nothing that happened after those instants informed this post.
- Prices are quoted on the SIZ2026 contract.
- The vol section is estimated (historical volatility is estimated from daily closes).
Section availability
Plain sentences are produced directly from the model readings. Text under a “Commentary” label was written by a language model from those readings only.